
Investigate foreign agents yourself here: https://clementbriens.github.io/fara-graph/
View the code here: https://github.com/clementbriens/fara-graph
Background
On December 13th, 2021, Open Secrets published a report describing how China paid American consulting firm Vippi Media $300,000 to hire social media influencers to promote the 2022 Winter Olympics held in Beijing. The nonprofit was able to expose China’s influence operation by scanning Foreign Agent Registrations Act (FARA) records published by the US Department of Justice (DoJ). This report came as part of wider analysis of FARA records by Open Secrets, publishing an online tool allowing journalists to quickly investigate government expenditure on foreign agents.
By reviewing FARA records, Open Secrets found some of the usual suspects amongst the top spenders in influence operations- in 2020, China topped FARA expenditure with more than $64m, followed by Qatar ($50m) and Russia ($42m). Top receivers included lobbying firms like Covington & Burling LLP and Akin Gump LLP.
What is FARA?
According to the DoJ’s website, FARA was passed in 1938 to help “the American people and their elected officials understand who is really behind” influence operations by foreign governments. Any government looking to conduct influence operations in the United States must do so by registering their activities under FARA, and disclosing information such as the monetary value of the contract, duration, and services provided. Under FARA, “influence operations” may include the employment of:
- Lobbyists
- PR firms
- “Prominent businesspeople”
- Former U.S. government officials
FARA designates any such entity or person as “agents” who are employed by “foreign principals”- i.e. foreign diplomatic or governmental bodies. In the case detailed above, Vippi Media was the registered agent, and the Chinese Consulate for New York was the foreign principal listed under FARA.

Inspecting FARA using Network Analysis
Goals
While Open Secrets mostly focused on analysing expenditure, I wanted to try a different approach: visualising and analysing FARA records using social network analysis methods. Social network analysis is a common tool for researchers analysing covert influence campaigns on social media platforms to identify suspicious clusters of accounts talking about or tweeting similar content at similar times.
Using network analysis, you can quickly investigate complex relationships between actors and identify patterns. in this case, I wanted to understand:
- Who are the major players in terms of agents registered under FARA?
- Are there agents outside of lobbying firms who lobby for multiple countries?
- Are there firms that lobby for rival countries?
- How do countries structure their influence operations?
The goal of this exercise was also to publish an interactive dataset usable by researchers, journalists and analysts to come to their own conclusions.
Collection
The DoJ very conveniently publishes its FARA records online, in a searchable, filtered, and pivotable online database (well done DoJ! \o/). The database also allows users to export selected data in CSV format, making analysis very easy.
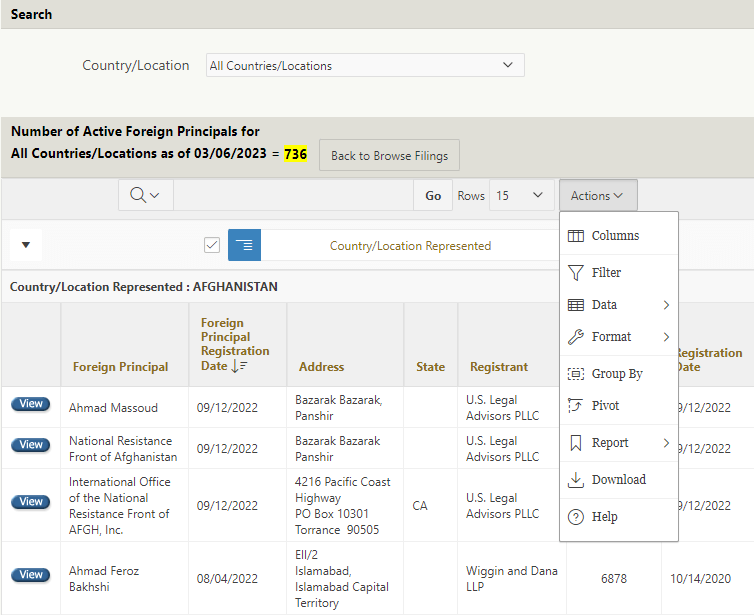
I was able to download the top 1000 most recent registrants who are still active (as of March 6, 2023).
By loading the CSV file into a Google Colab (or Jupyter Notebook), I was able to generate a list of nodes (including each node’s type: country, foreign principal, registrant, name, and country of origin) and a list of edges (these represent relationships: country → foreign principal, foreign principal → registrant). With our node and edge lists ready, we can begin our network analysis using Gephi, a common network analysis tool.
Visualisation
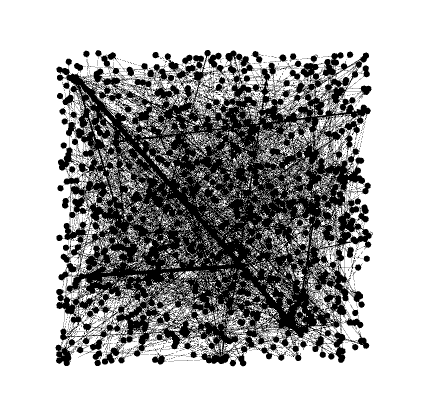
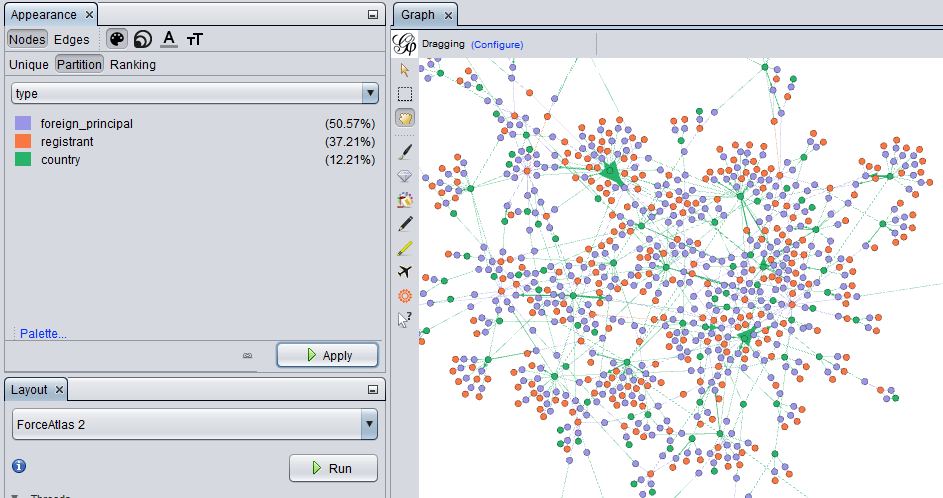
Loading the data into Gephi, I was able to easily visualise the FARA records. Click “Import Spreadsheet” and Gephi will walk you through the import process for both your node and edge list. You’ll start off with the following graph:
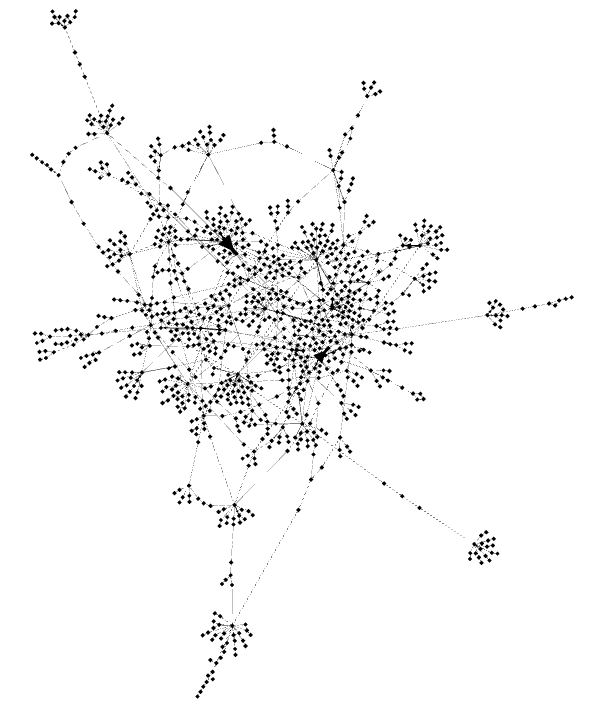
We’re going to start by using a layout algorithm to display our nodes in a way that’s a bit more easy on the eye. There are a variety to choose from, so I recommend experimenting with whichever looks best. I tend to use ForceAtlas2 (or Fruchterman Rheingold when investigating social media accounts). Select your algorithm on the left and hit RUN. You’ll want to keep tweaking your graph’s layout by using the Dissuade Hubs and Prevent Overlap settings, as well as using the Expansion and Contraction layout algorithms judiciously.
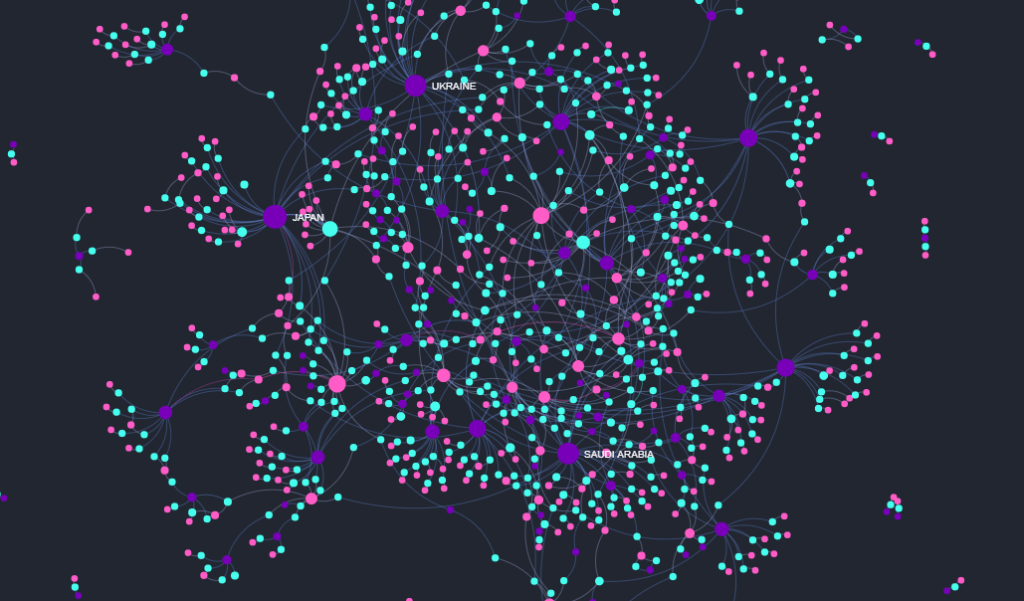
We’ll now colour and resize our nodes. To do this, go on the top right and hit the palette button under Nodes, then partition, and ‘type’. This will colour our nodes according to their type: you can set your desired colours for countries, foreign principals and registrants.
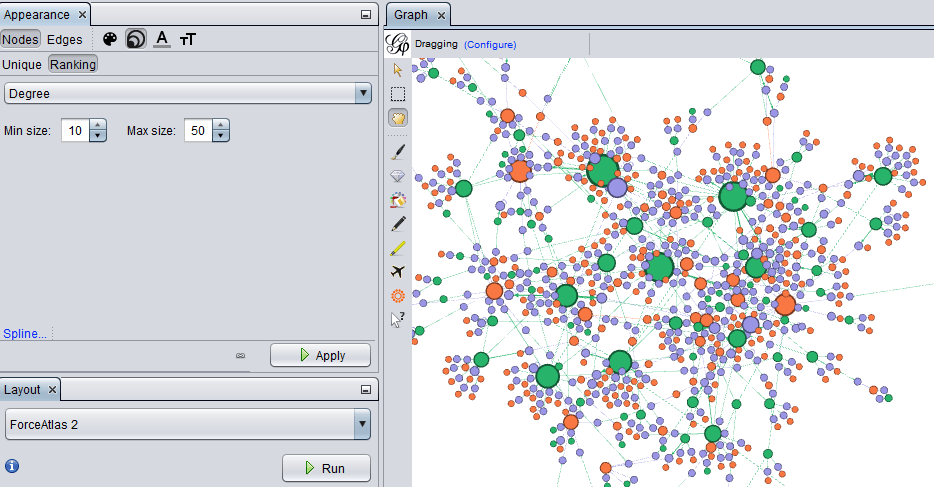
We’ll also change the node size to ‘Degree’ under ‘Ranking’. This will resize our nodes by the number of in-degrees (incoming relationships) and out-degrees (outgoing relationships), to make busier nodes larger and highlight the major players in our dataset.
Analysis
We now have a fully fledged graph of the most recent 1000 FARA records at our disposal.
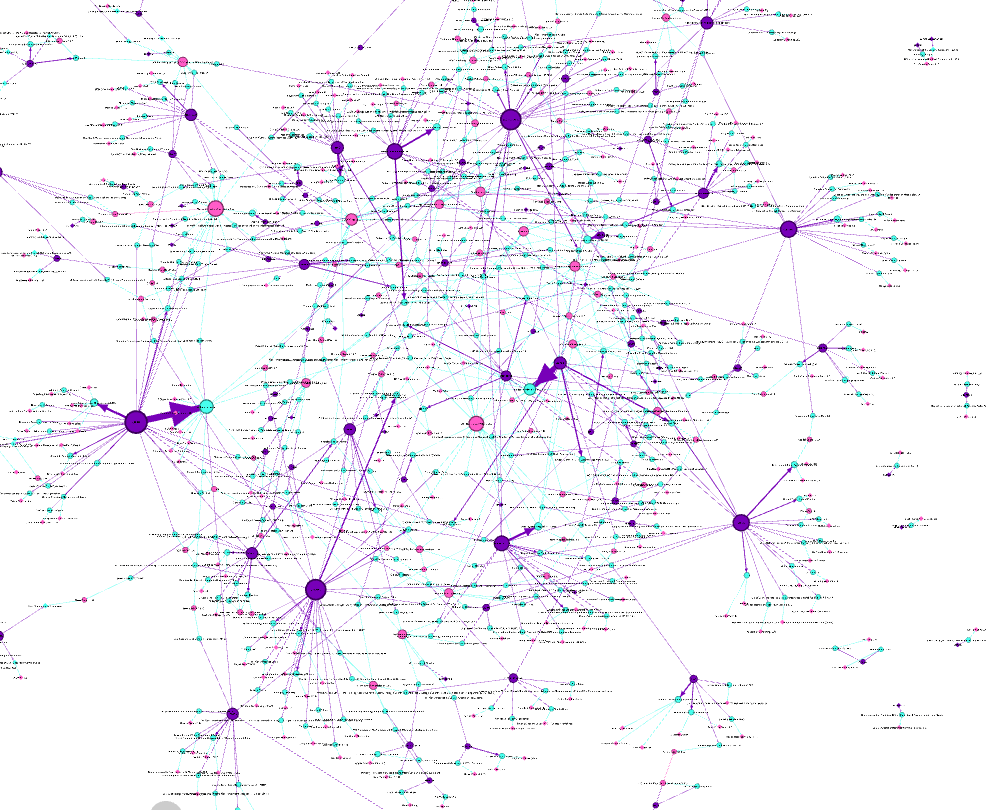
By examining our graph, we can get some pretty interesting initial conclusions:
Countries sometimes use multiple foreign principals to register the same foreign agent. Saudi Arabia, for example, used both Saudi Aramco and the Government of the Kingdom of Saudi Arabia as foreign principals to register Saudi Petroleum International Inc. and Aramco Affiliated Services Company (AASC).
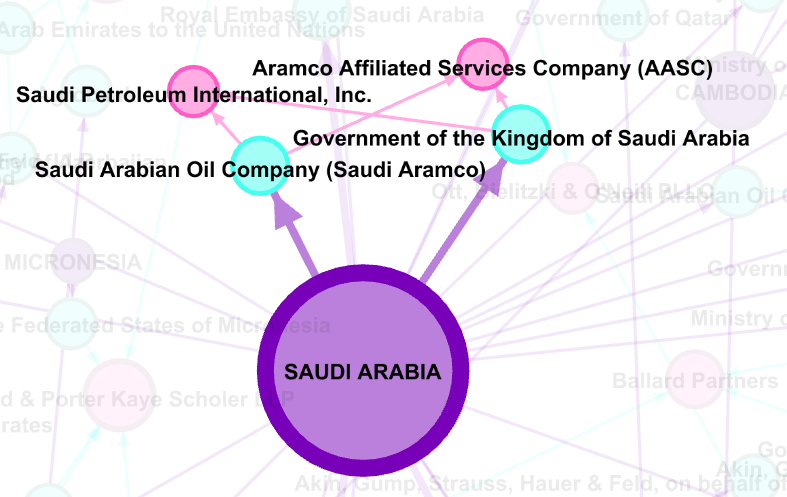
This is unsurprising given that Saudi Aramco is a state-owned company, which has operations in the US. No scoop here.
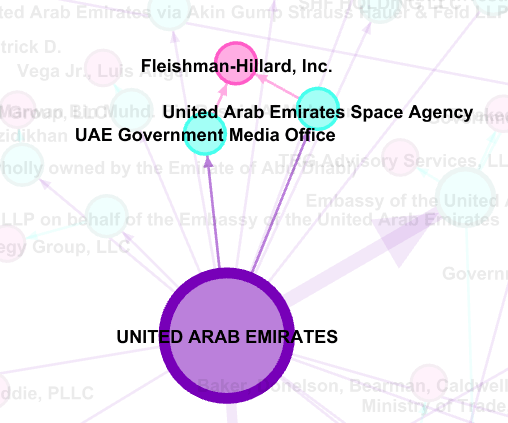
Other examples include the United Arab Emirates (UAE) who used both the UAE Government Media Office and UAE Space Agency as foreign principals to register Fleishman-Hillard Inc., a self-described “global marketing and PR agency”. Both state departments contracted the company for PR-related activities at the 2023 World Economic Forum held in Davos ($24,706) and the Abu Dhabi Space Debate held in December 2022 ($34,750).
An alternate graph we can generate for further insights is by simplifying our graph by removing foreign principals, and drawing edges directly between countries and registrants.
You can view this graph here: https://clementbriens.github.io/fara-graph-bipartite/#
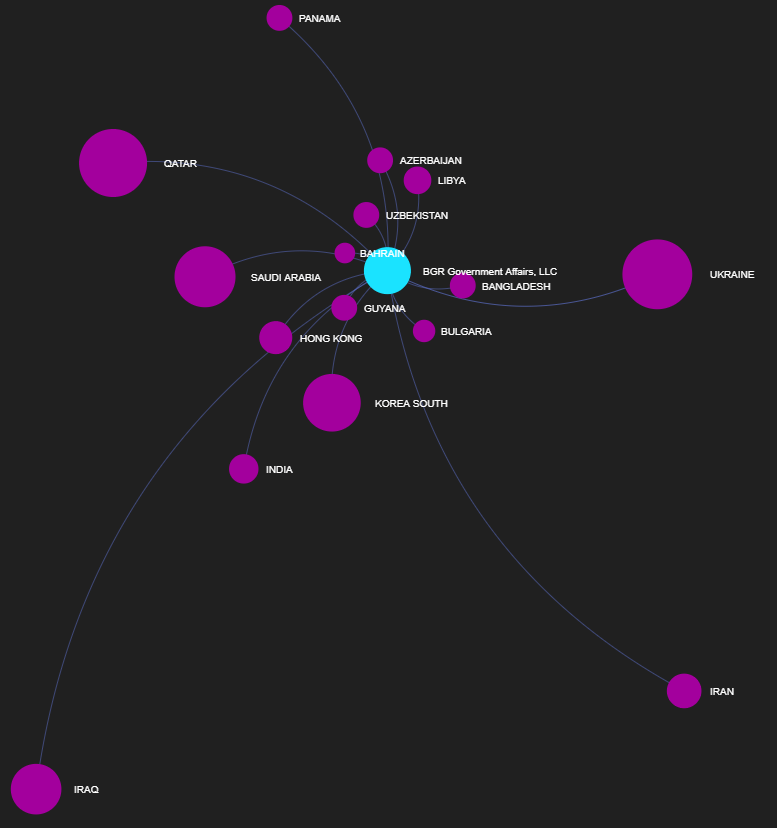
This makes our analysis of countries sharing registrants a lot simpler. For instance, we can quickly see which countries major lobbying firms deal with. BGR Government Affairs LLC, for instance, works with clients from both Gulf countries (Qatar, Saudi Arabia, Bahrain) and Iran, as well as Iraq- all of which are geopolitical rivals.
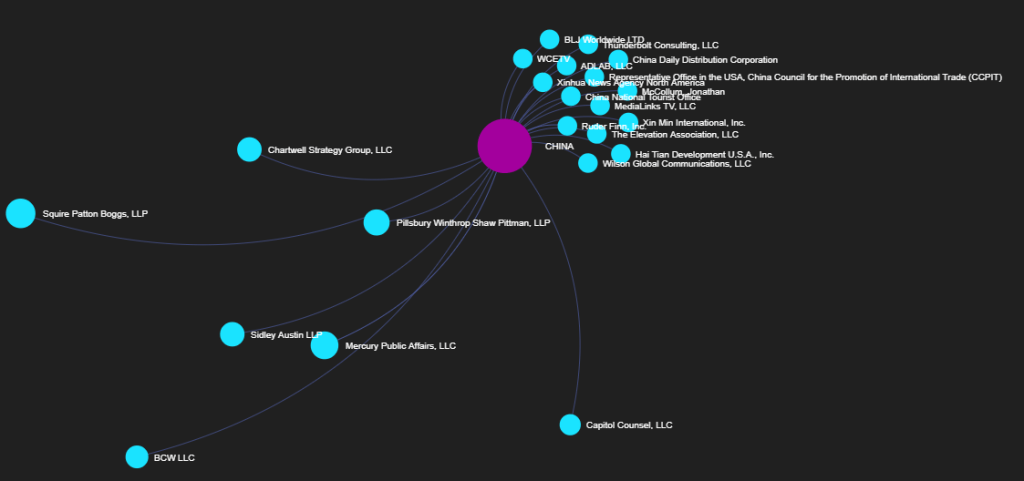
We can also look at the reverse: all registered agents for a single country. China, for example, has more than 20 registered agents operating in the US:
Conclusion
Network graphs have always been one of my favorite ways to represent data to the intuitive understanding and overview you can obtain.
Government records are typically very opaque, and can bog down investigations without such an intuitive visualization method. In this case, visualizing FARA records using network graphs allow investigators to quickly understand complex relationships between foreign governments, their diplomatic bodies and the firms they employ to influence US politics.
I’ve barely scratched the surface in terms of analysis of this data, so I hope that smarter journalists/researchers/analysts will be able to benefit from this approach, either by using the provided tools or by replicating my methodology.
If you do end up using this approach or these tools, make sure to let me know @clementbriens on Twitter.
Acknowledgements
To serve the FARA network graph on Github, I used the following tutorial: https://blog.miz.space/tutorial/2020/01/05/gephi-tutorial-sigma-js-plugin-publishing-interactive-graph-online/

Leave a comment